After talking in a previous article about basic metrics and giving you some recommendations on how to configure your cycle computer screens, today we go a little deeper.
The following metrics are for those cyclists who, in addition to correctly carrying out the training they have to do, They want to monitor the metrics that represent their physical condition and subsequent performance.
Although we are aware that there are different software, In this article we will refer to those commonly used in TrainingPeaks, such as the following metrics:
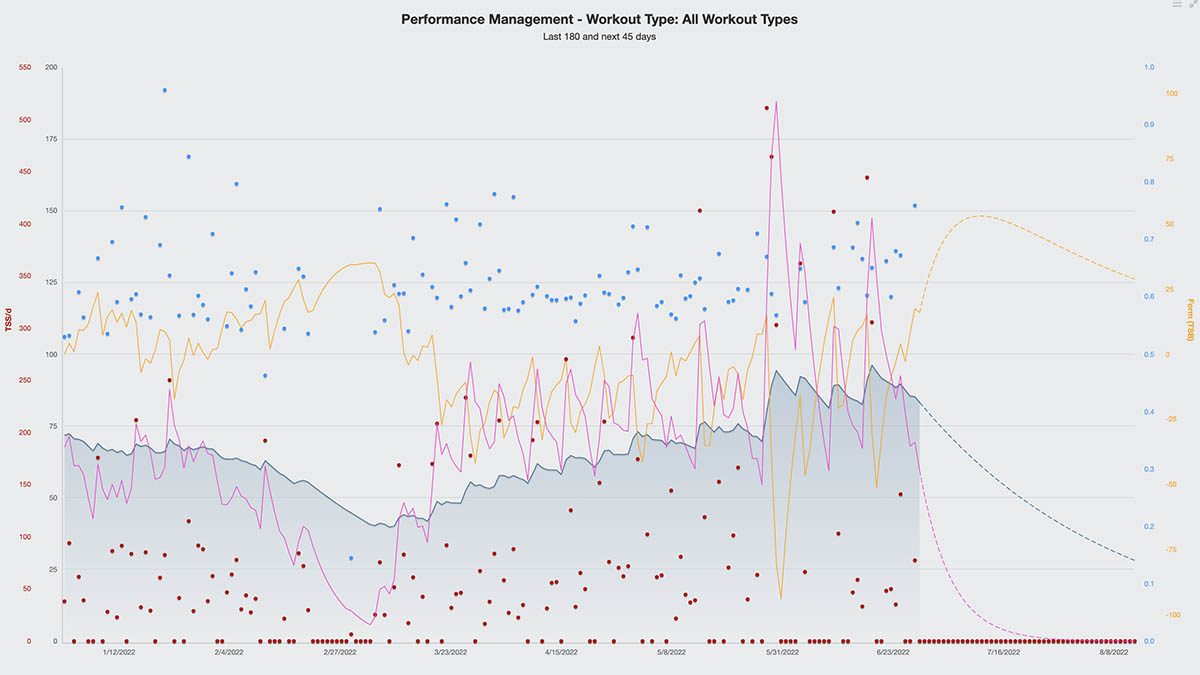
ATL: Acute Training Load. It is the short-term workload, usually as an average of the last 7 days. Shown in pink and under the name fatigue. It represents the cost that a block of training of a certain duration (short) produces on your body.. Don't be alarmed if you see it going up, Doing so is necessary since our body adapts and improves after exposing it to one or more workloads.. Just make sure you moderate it., adding breaks or reducing the load after these training periods.
CTL: Chronic Training Load. It is the long-term workload, usually as an average of the last 28-42 days. Shown in blue and under the name fitness. It represents the cost that a longer block of training produces on your body. Make sure that this value increases slowly and progressively, reaching its highest values at times close to important competitions.
TSB Training Stress Balance: Represents the relationship between fatigue and fitness, and tells us whether or not we are ready to take advantage of our maximum potential.. It is shown in yellow and under the name form. Successive periods of training will make the value negative, while periods of rest will raise it to positive. Being at the extremes can represent overtraining and undertraining. Try to keep it at values close to the 0 in the important moments of the season.
TSS Training Stress Scor: It is a numerical value that represents the workload that a training has involved.. Volume and intensity, directly affect this value, Depending on the duration of an exercise or interval and its intensity, this value can increase. It could be said that it is a value for quantifying the stress that the body endures in relation to training..
Pw:Hr power:heart rate: Also called aerobic uncoupling. Compare the relationship between power and heart rate at the beginning of a workout or interval with the end of it. Values lower than 5% They could indicate that you are prepared to face a more intense or longer workout..
EF Efficiency Factor: It is the ratio between power developed and pulses per minute for a specific workout or interval.. If your heart pumps at 100ppm to generate 100w of power, your EF will be 1. (100/100). Higher EF values, for similar intensities, indicate greater aerobic efficiency. Direct conditioning of performance in endurance sports and the longer the test., most determining factor in performance.
Add that some of this data is only accessible to premium accounts. But if you dare to review your training with your coach, It can make your day-to-day life even more fun and motivating in your preparation for that test or challenge that you want to do so much..